Mermaid.js lets you create flowcharts, graphs, and other kinds of diagrams, and uses a custom language to define how they look. It turns text into diagrams!
You can customise all kinds of details: the colours, line widths, and even more. But the defaults are pretty nice – it makes good-looking results with little effort.
Here are some examples:
classDiagram
class Base_Info {
setConfig()
}
class Registration_Info {
currentRegistrationListPage: Integer
totalRegistrationPages: Integer
registrationPageItems: Map[page -> list of bhid's]
registrationInfo: Map[bhid -> info returned by API]
setRegistrationPage()
getBaseRegistrationInfo()
}
class Occupancy_Info {
occupancyPageInfo: Map[bhid -> pageInfo]
occupancyHistory: Map[bhid -> Map[page -> list of states]]
setOccupancyPage()
}
flowchart LR
Request(Get request) --> Available(See if package is available)
Available -->|Yes| Hooray(fa:fa-gift Hooray, we can return it!)
Available -->|No| Sad(fa:fa-heart Return a sad face)
Here I’ll go through where to use Mermaid and how to make the best diagrams with it. If you have any questions, please ask the wonderful Mermaid community or send me an email!
Note, this is an adaption of a page I made for my workmates at Sendle. Ship on the bright side and see them for all your package shipping needs!
Mermaid diagrams are plain text. Because the diagrams are plain text, you can commit them into your code repos and use them in a docs-as-code workflow. GitHub, GitLab, and Gitea also natively support rendering Mermaid diagrams in Markdown files and wiki pages.
Diagrams are standard and consistent. Since Mermaid handles how your diagrams are laid out, there’s less tweaking and flexibility in exactly how your diagrams look. But I’d argue this is usually a good thing, as it makes it easier for others to match the style of your diagrams.
It makes you focus on the content. Graphical tweaks and precisely laying out elements aren’t Mermaid’s strong suite. In my experience, that means I need to focus on the content more and can end up with cleaner, simpler diagrams.
Where is Mermaid not the right choice?
Sometimes Mermaid’s not the right choice. Here’s where I’ve avoided using it:
Extremely complex processes. Mermaid supports subgraphs and other features which make it possible to show extremely complex processes, but at a point you may need to use a tool that lets you place things more precisely. Of course, at this point you may want to split it into separate graphs or think about alternate ways to express the information. Knut Sveidqvist, the creator of Mermaid, also has some advice for complex flowcharts.
Fancy graphical work. Mermaid diagrams are clean and easy to read. But you may want designers to add fancy gradients, make your diagrams follow branding requirements, and add custom logos.
In those cases, you can use Mermaid to plan our your diagram (it’s easy to make large changes while working out how to describe the flow/process/etc), and then show the designers the Mermaid diagram so they can create the fancy version of it.
That’s what we did for this How a VPN protects your connection article, see the original Mermaid diagram I delivered and the final, pretty one our designer made:
Once you’ve got a decent idea of how Mermaid works, check out the other Diagram Syntax pages on the left to see specifics of each diagram type.
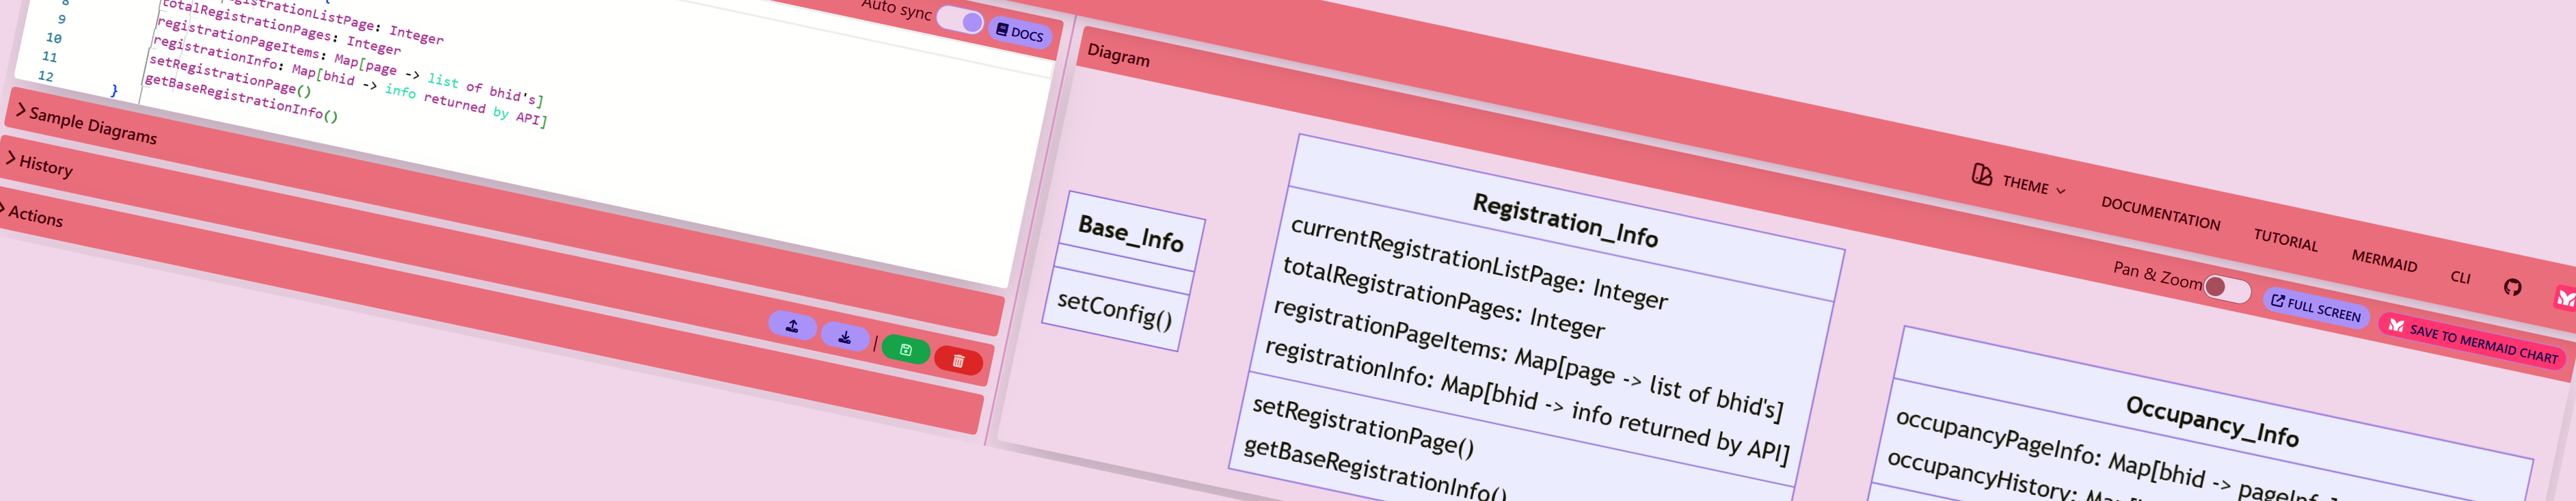
The Live Editor
I use the live editor whenever I’m working on a new diagram, or even modifying existing ones. It makes it easy to see examples, see how your diagram changes in real-time, and export it as an image when the system you’re using doesn’t render Mermaid diagrams natively.
Mermaid also supports the free FontAwesome icons! The official documentation is on this page, but I’ll describe the feature in more depth here.
Using icons
Once you’ve found an icon you like from the FontAwesome icons list, use the ID underneath the icon in your diagram with the fa: prefix. And if you’re using a brand icon, use the fab: prefix.
Here’s how these look in a diagram:
flowchart LR
    Request(fa:fa-upload Request)
    Search(fa:fa-search Searcher)
    DB(fab:fa-python Database)
    Request --> Search --> DB
And here’s the code:
flowchart LR
Request(fa:fa-upload Request)
Search(fa:fa-search Searcher)
DB(fab:fa-python Database)
Request --> Search --> DB
Troubleshooting and font aliases
FontAwesome version 5 is supported, and which icons are available in your diagrams depends on how it’s configured. For example, if brand icons don’t show up you may need to make sure that your site/tool is pulling in the Brand icons from FontAwesome.
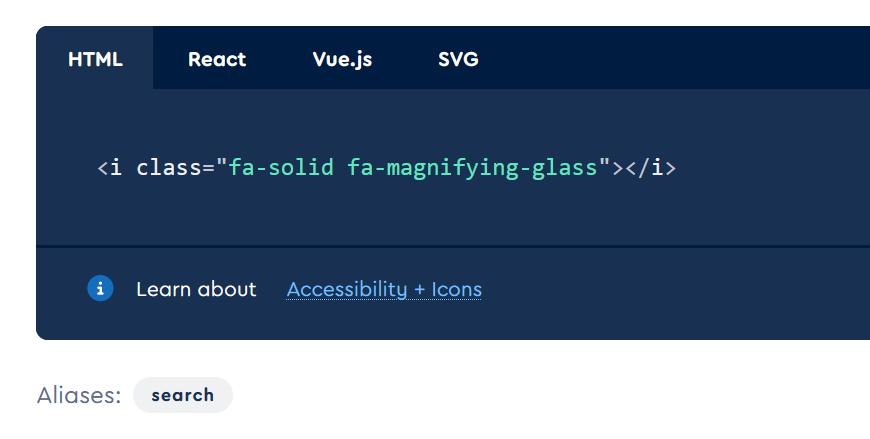
If the icon still doesn’t show up you may need to use an alias. For example, this icon:
Using fa:fa-magnifying-glass may make the icon appear. If that doesn’t, you should try fa:fa-search to see if that works.
Exporting diagrams with icons
Now, let’s talk about exporting diagrams with icons when using the live editor. I’ll export an SVG or PNG image of the diagram when the system I’m using doesn’t support Mermaid natively (e.g. Google Docs, ReadMe, and the like).
When using icons, the diagrams may look good in the live editor but not when exported. Here’s the above diagram exported from the live editor:
Sometimes the export works fine, so give this a try first.
But when the exporting does fail, this is what I do:
Grab the vertical line separating the code from the diagram, and drag it all the way to the left so the diagram takes up most of the page.
Press Win+Shift+S (Windows) or Command+Shift+4 (macOS) to take a screenshot, and select the area around the diagram.
If on Windows, click on the popup and save the image. If on macOS, the screenshot will be on the desktop.
And now you can use that screenshot of the diagram in your document/page. If you know a better way to do this, please let me know!
Let’s make a diagram!
So now let’s try making one. Here I’ll make a flowchart showing how to book a return order with the Sendle API, but the same steps will work for any kind of diagram.
Planning
Here’s where we lay a foundation. We get to go through possibilities and explore different kinds of diagrams, try things out, and see what’s the most understandable. Do whatever gets you thinking!
Get something to write with and write on. Planning out your diagram before you jump into the tool always improves your end result.
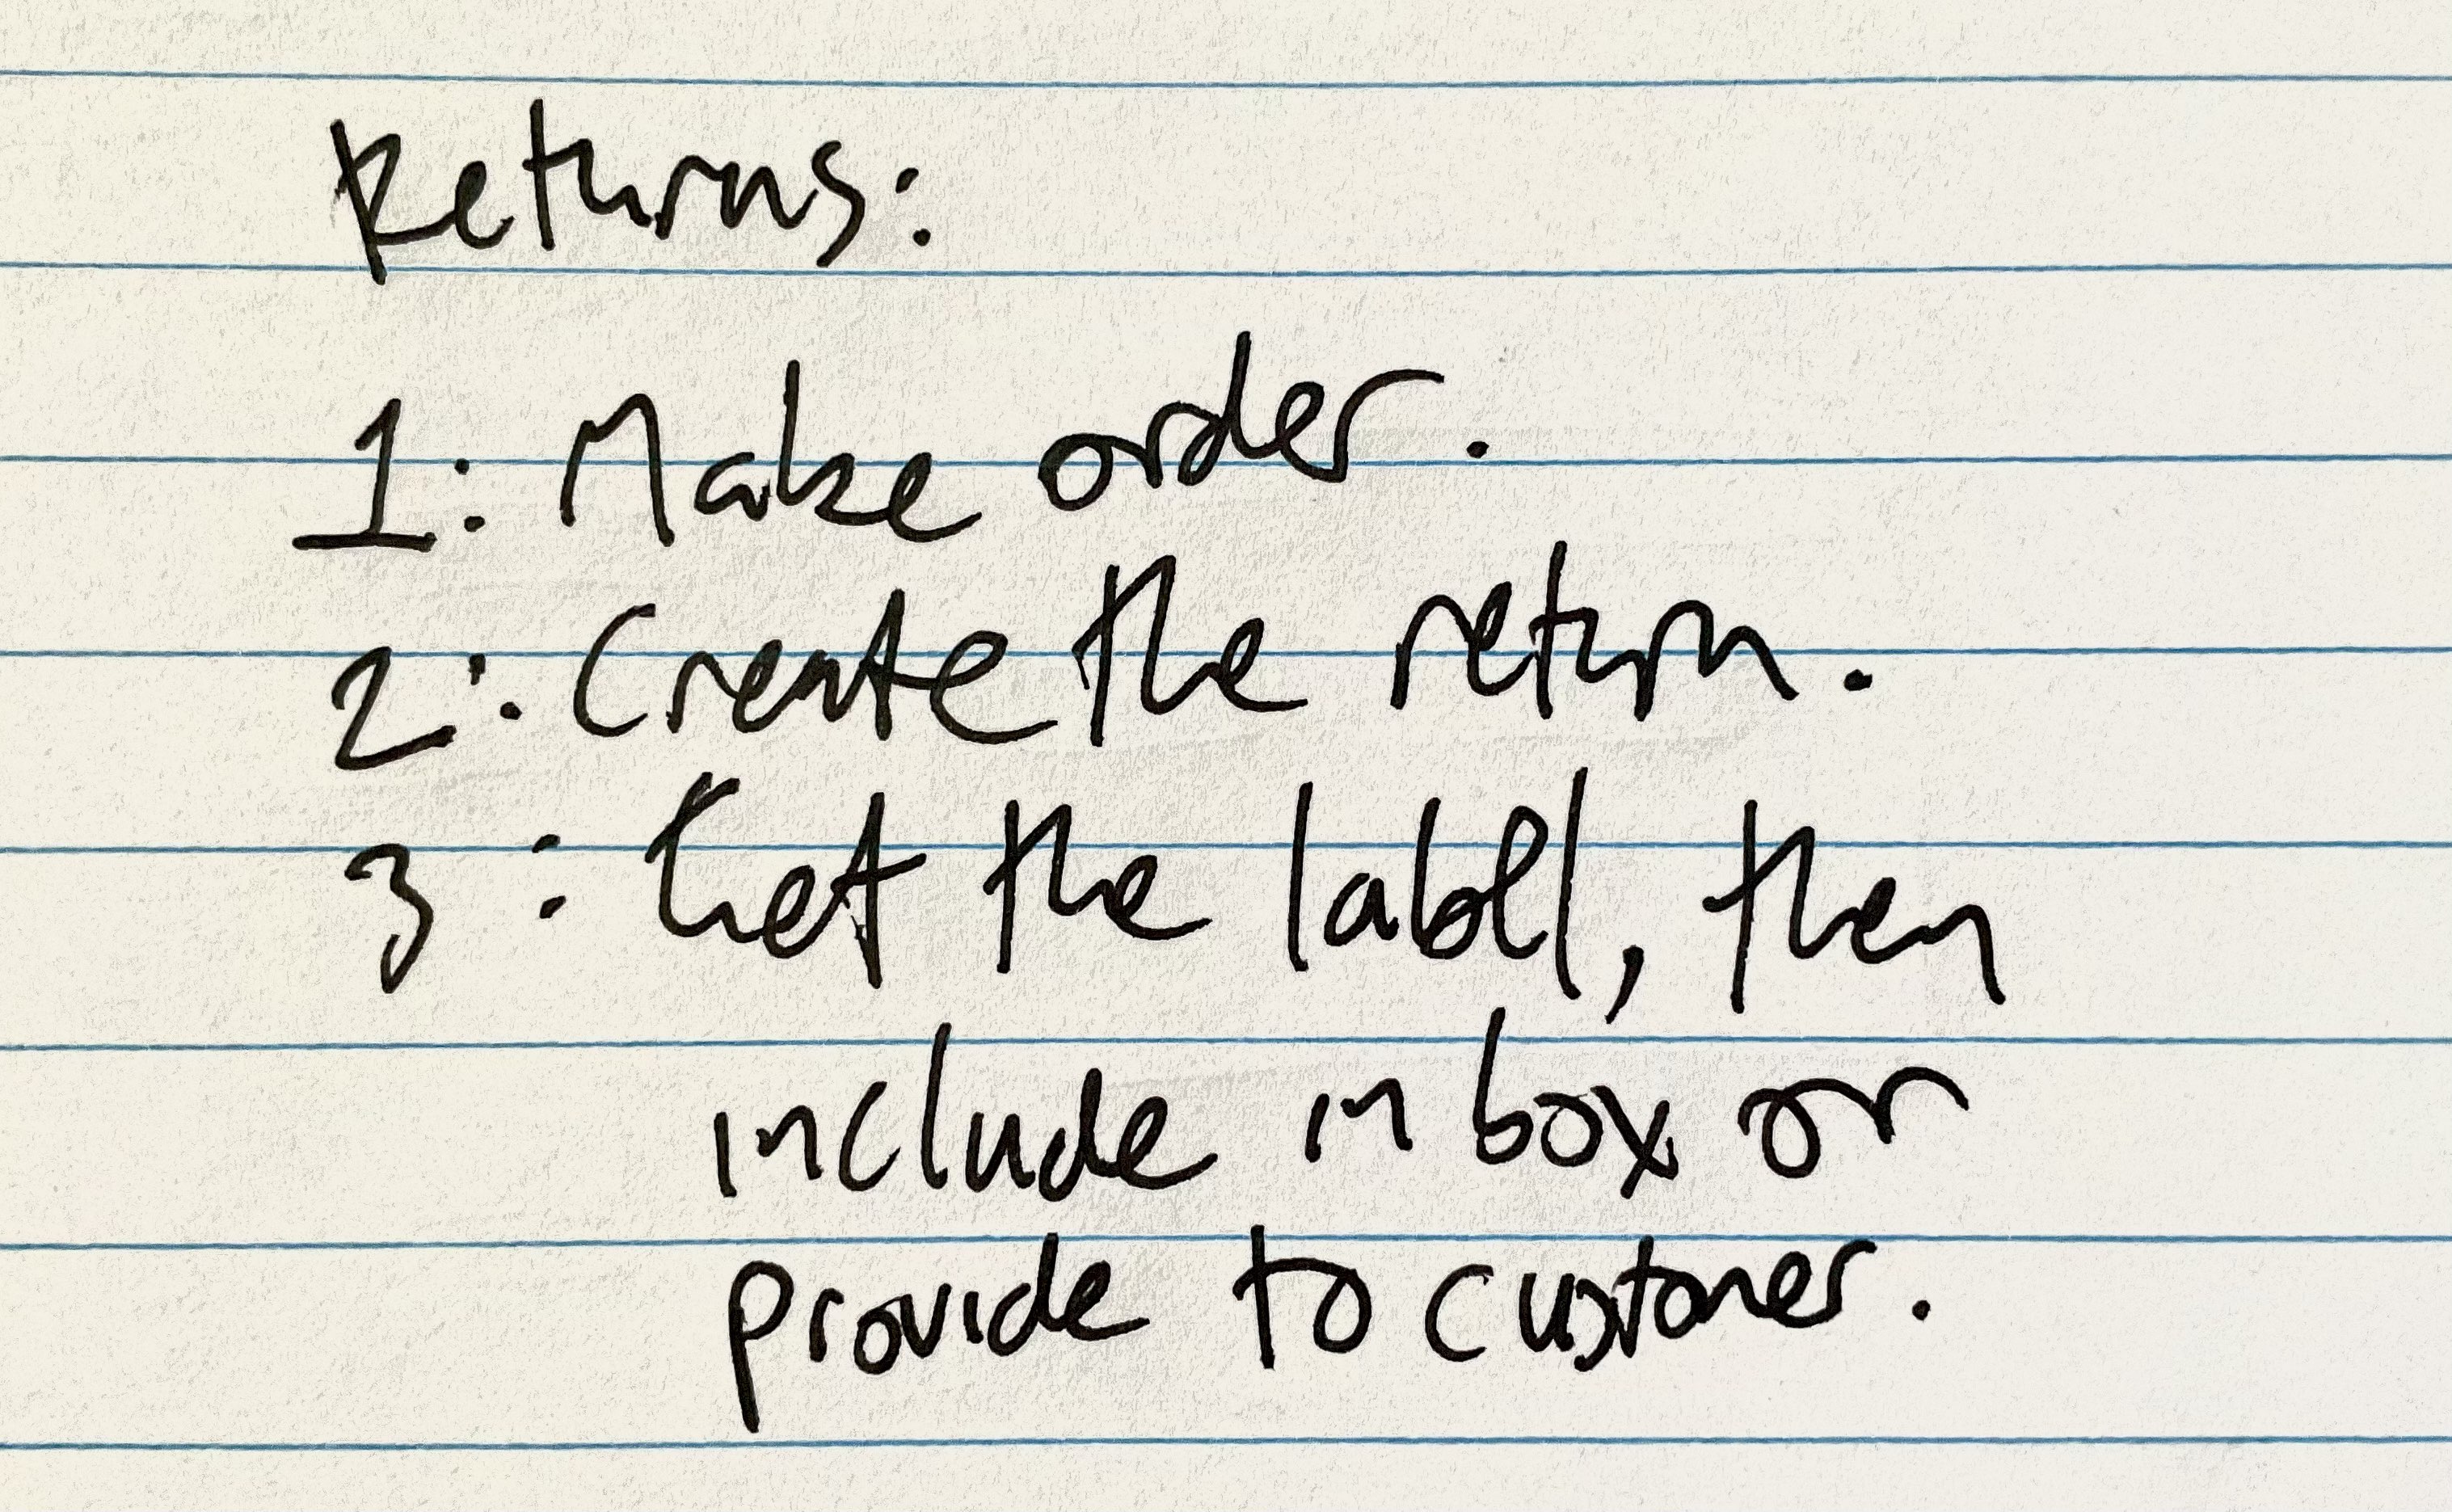
Write down what you want your diagram to explain, as simply as you can: This may seem too simple to bother writing down, but I find myself referring back to it constantly.
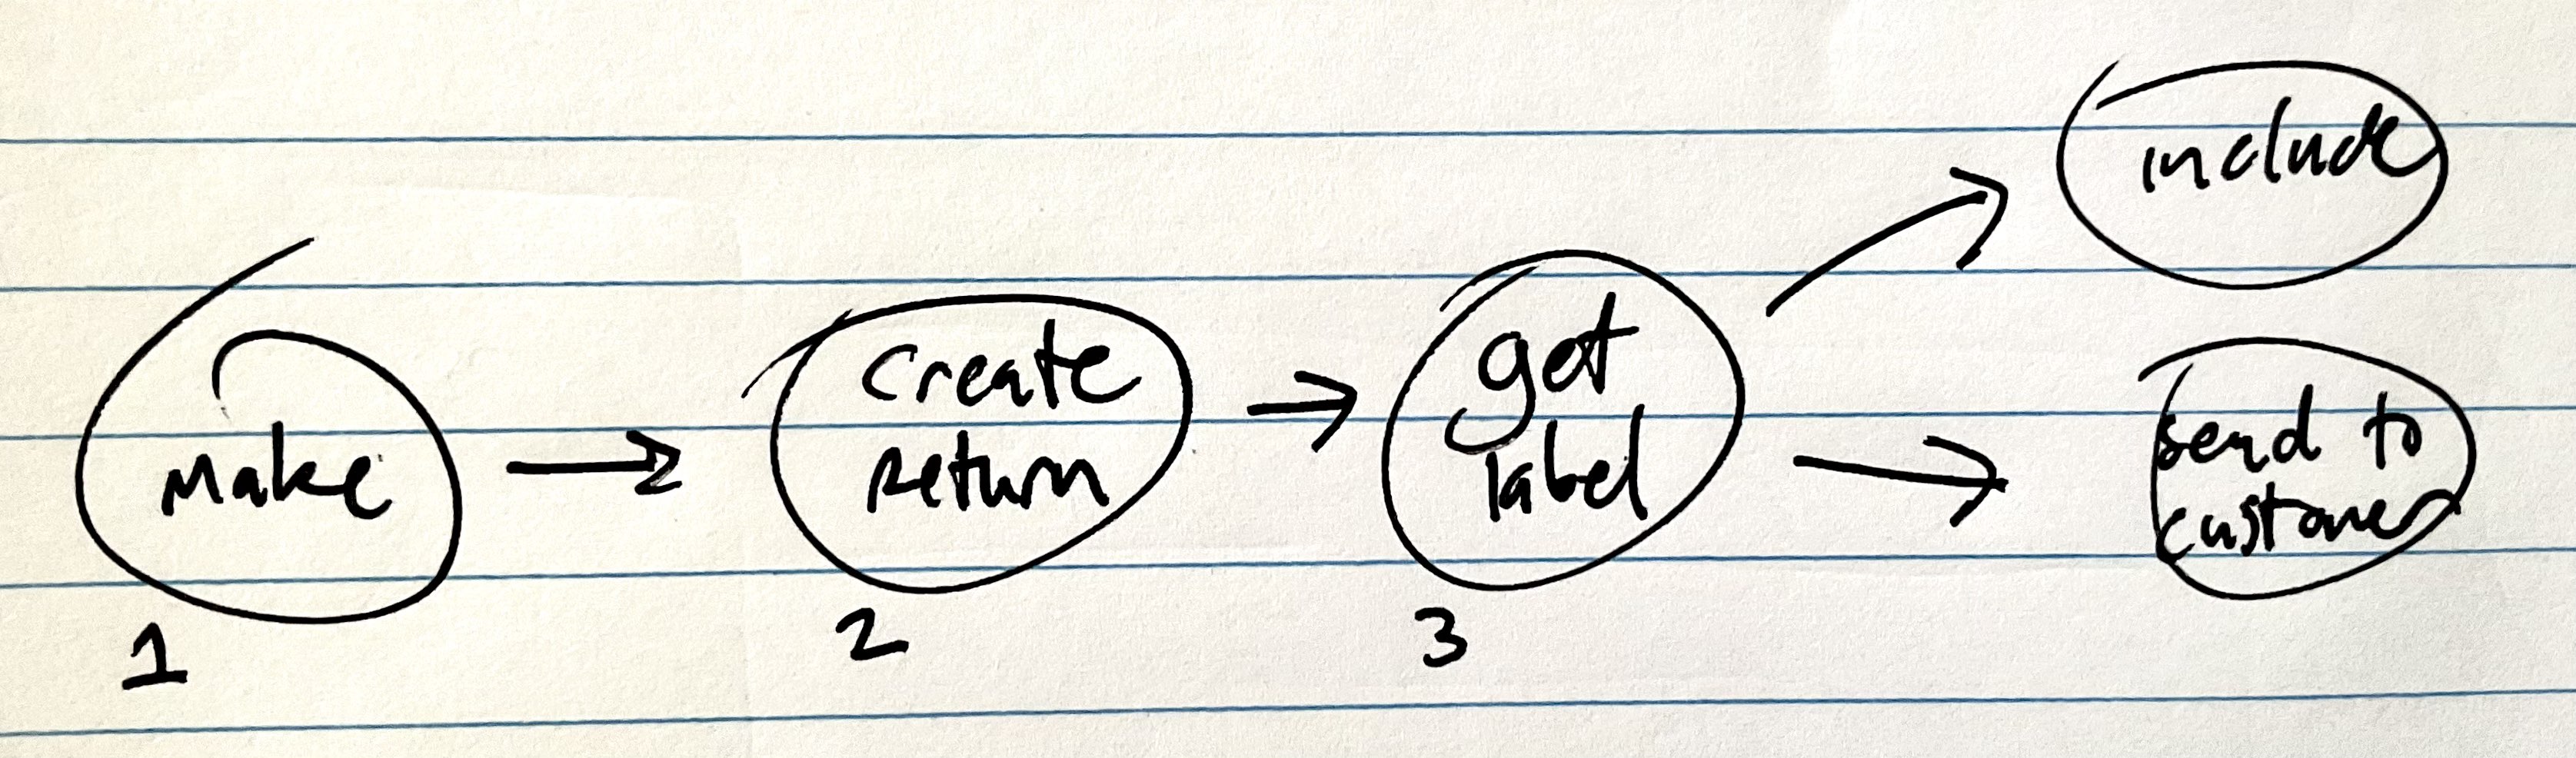
Try sketching some layouts. I like to visit the Mermaid live editor and click between the Sample Diagrams while doing this, since that has some good examples. Here’s my sketch: It doesn’t include all the text that the outline above does, and it’s rough. But that’s fine, it just needs to look understandable and include the steps in our description above. Sometimes my initial sketches don’t include any words at all, and it’ll just be the boxes and arrows.
Basic version
Now that we have an idea in mind, let’s use the live editor to create a basic version. Here’s what I’ve got, based on the above:
flowchart TD
    Make[Make an order]
    CreateReturn[Create a return for that order]
    GetLabel{Get the return label}
    Include[Include in the package]
    Send[Send to the customer]

    Make --> CreateReturn --> GetLabel
    GetLabel --> Include
    GetLabel --> Send
flowchart TD
Make[Make an order]
CreateReturn[Create a return for that order]
GetLabel{Get the return label}
Include[Include in the package]
Send[Send to the customer]
Make --> CreateReturn --> GetLabel
GetLabel --> Include
GetLabel --> Send
Refining
Here’s where we get to make our diagram look nice.
First off:
The square edges on the boxes look unplesant. We can replace the [Node descriptions] with parentheses, to make the boxes rounded!
The diamond node is pretty big, so let’s try a new node shape. Looking through the flowchart docs, the stadium-shaped node is still distinct and takes up less space.
Having the flowchart top-down makes it tall and wide, which takes up a lot of space. If we replace flowchart TD with flowchart LR, it’ll take up less vertical space.
After these changes, here’s our diagram:
flowchart LR
    Make(Make an order)
    CreateReturn(Create a return for that order)
    GetLabel([Get the return label])
    Include(Include in the package)
    Send(Send to the customer)

    Make --> CreateReturn --> GetLabel
    GetLabel --> Include
    GetLabel --> Send
flowchart LR
Make(Make an order)
CreateReturn(Create a return for that order)
GetLabel([Get the return label])
Include(Include in the package)
Send(Send to the customer)
Make --> CreateReturn --> GetLabel
GetLabel --> Include
GetLabel --> Send
Let’s do some editing on the text, to make it easier to read. We’ll try to improve the descriptions while keeping each node as short as possible.
Note, you can include the <br> tag inside labels to split them across multiple lines. This lets you include more text while keeping the label relatively small.
Here’s our result after improving the text:
flowchart LR
    CreateOrder(Create an order)
    PrepareReturn(Prepare a return order)
    GetLabel([Get the return label])
    Include(Print and include it<br>in the package)
    Send(Send the label to the<br>customer for them<br>to print out)

    CreateOrder --> PrepareReturn --> GetLabel
    GetLabel --> Include
    GetLabel --> Send
flowchart LR
CreateOrder(Create an order)
PrepareReturn(Prepare a return order)
GetLabel([Get the return label])
Include(Print and include it in the package)
Send(Send the label to the customer for them to print out)
CreateOrder --> PrepareReturn --> GetLabel
GetLabel --> Include
GetLabel --> Send
Finally, let’s give our diagram that professional touch with the use of some icons. Also, while a diagram full of text is fine, including some carefully-chosen icons helps with understanding.
flowchart LR
    CreateOrder(fa:fa-box fa:fa-arrow-right <br> Create an order)
    PrepareReturn(fa:fa-box fa:fa-arrow-left <br> Prepare a return order)
    GetLabel([fa:fa-tag <br> Get the return label])
    Include(fa:fa-print <br> Print and include it<br>in the package)
    Send(fa:fa-share <br> Send the label to the<br>customer for them<br>to print out)

    CreateOrder --> PrepareReturn --> GetLabel
    GetLabel --> Include
    GetLabel --> Send
flowchart LR
CreateOrder(fa:fa-box fa:fa-arrow-right Create an order)
PrepareReturn(fa:fa-box fa:fa-arrow-left Prepare a return order)
GetLabel([fa:fa-tag Get the return label])
Include(fa:fa-print Print and include it in the package)
Send(fa:fa-share Send the label to the customer for them to print out)
CreateOrder --> PrepareReturn --> GetLabel
GetLabel --> Include
GetLabel --> Send
It’s a small change, but I think it gives your diagram that extra bit of wow.
Done!
And with that, our diagram is finished and ready to be put onto a page! On the Sendle Returns page, you can see how the diagram’s steps are broken down and explained in more detail just underneath it.
Make sure to surround your diagram with whatever information is needed to really understand it!
Finally
I hope I’ve given you some good tips, tricks, and advice to help you make better diagrams. I started using Mermaid several years ago, and it’s really taught me just how important and useful diagrams can be when explaining concepts.